Edit May 21 2021
I made a short video presentation on the subject, as a “flash” talk for the OME Community Meeting 2021: https://youtu.be/inGQXtbzoZI .
Summary
This tutorial gives a step-by-step instruction on annotating containers (Projects, Datasets, Plates, or Screens) and individual or multiple images. In particular, we show how to annotate selected images in batch mode using spreadsheet documents as a convenient method to record metadata during or after an experiment.
One word of caution: This post may seem long and complicated. Before hitting that “Close window” button, please consider that this is the natural consequence of going through every little step of the process as detailled as needed. After going through all the steps, you will find it much more easy and natural to annotate images. Hence, a little investment of your precious time will speed up the admittedly tedious process of image annotation in the long run.
Contents
- Annotate the dataset using an annotation form
- Batch annotation using a spreadsheet
- The best of both worlds: Spreadsheet templating and batch annotation
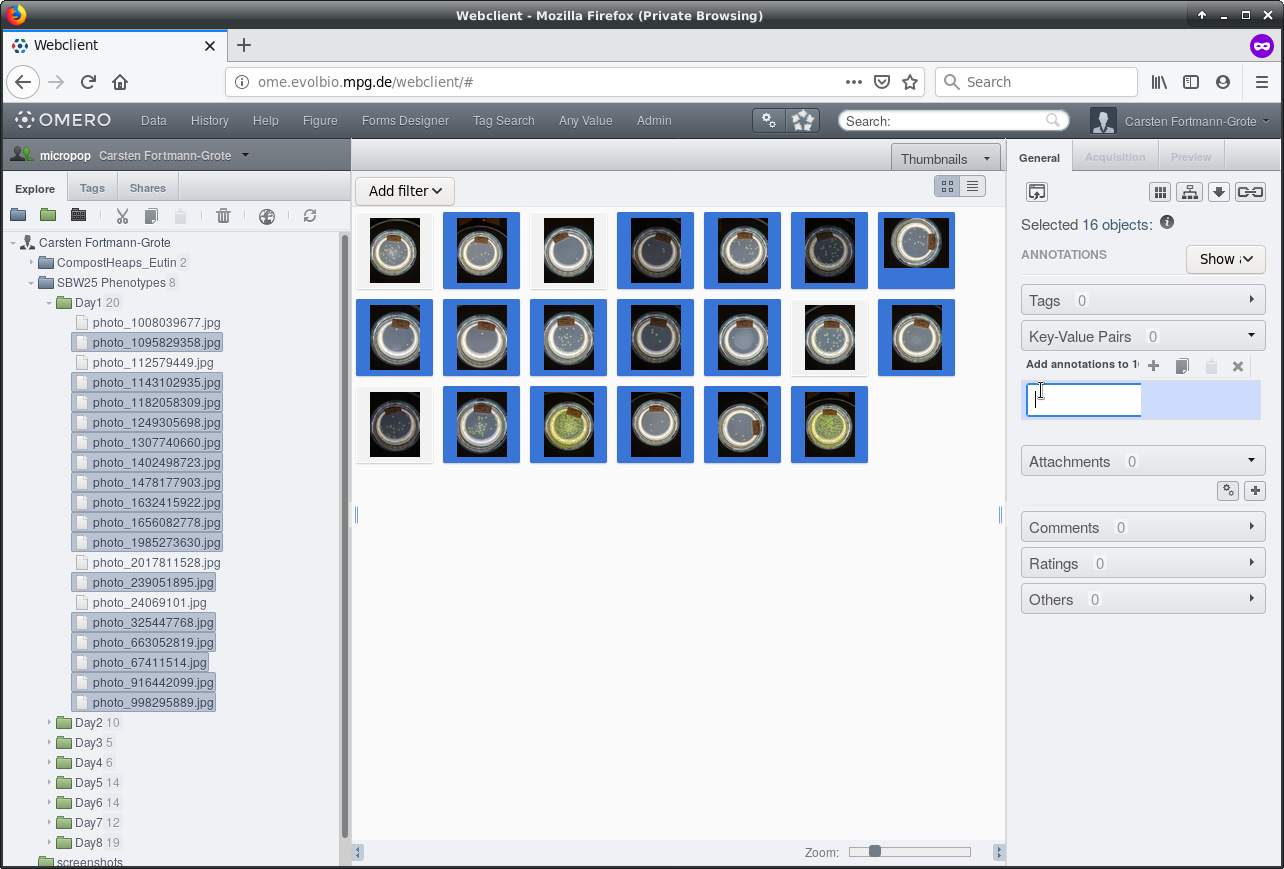
Here’s our example dataset:
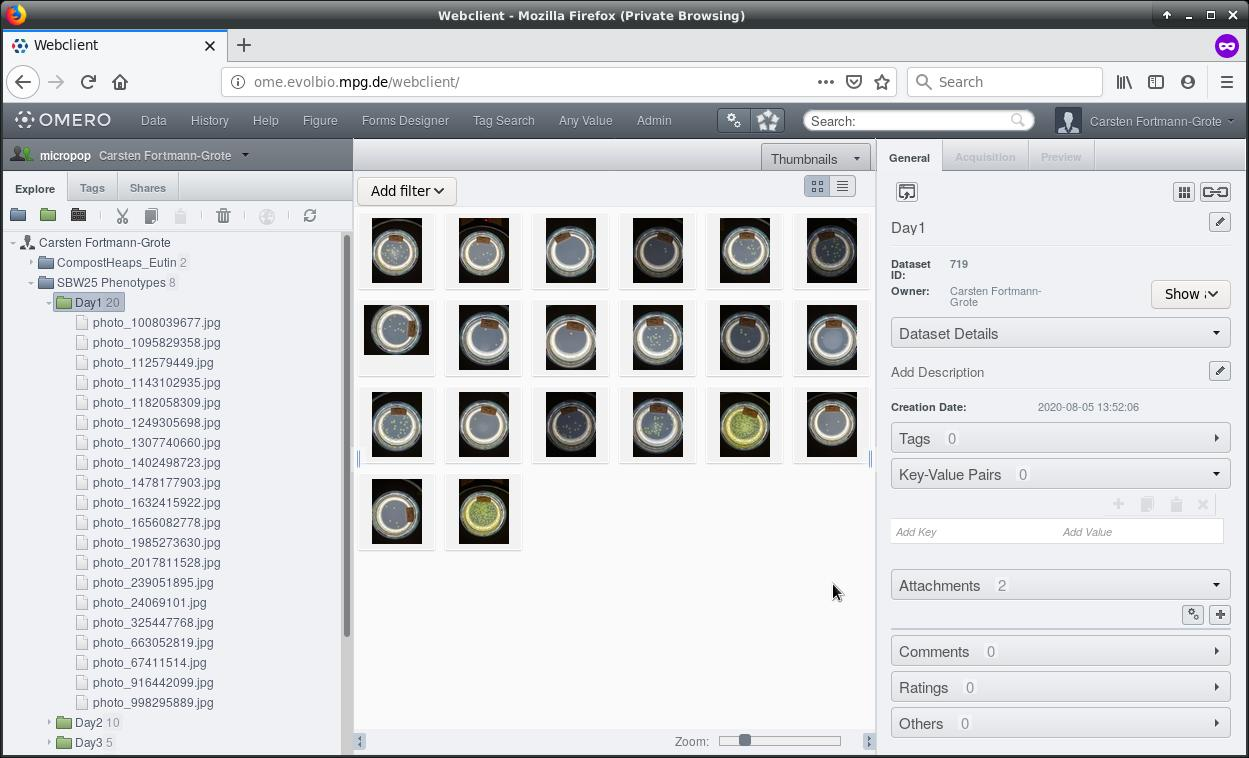
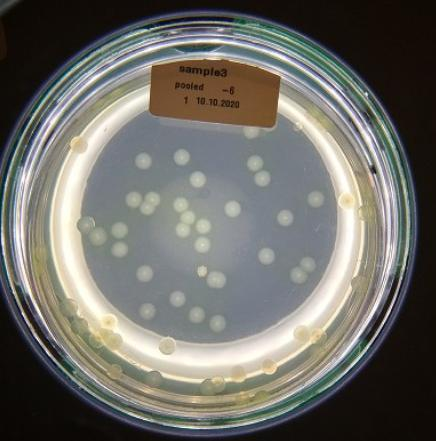
The dataset contains 20 images of plated Pseudomonas fluorescens strain SBW25 cultures. Each petri dish is labeled with a tag showing the date of the experiment, the sample number, and a pool number.
Our goal is to tranfer this information into the omero database to make images findable based on their experimental metadata.
Using an annotation form
First, we will add some general metadata to the dataset. Later, we will add annotations to each individual image, such as the sample number, and the pool. These data are different for each image.
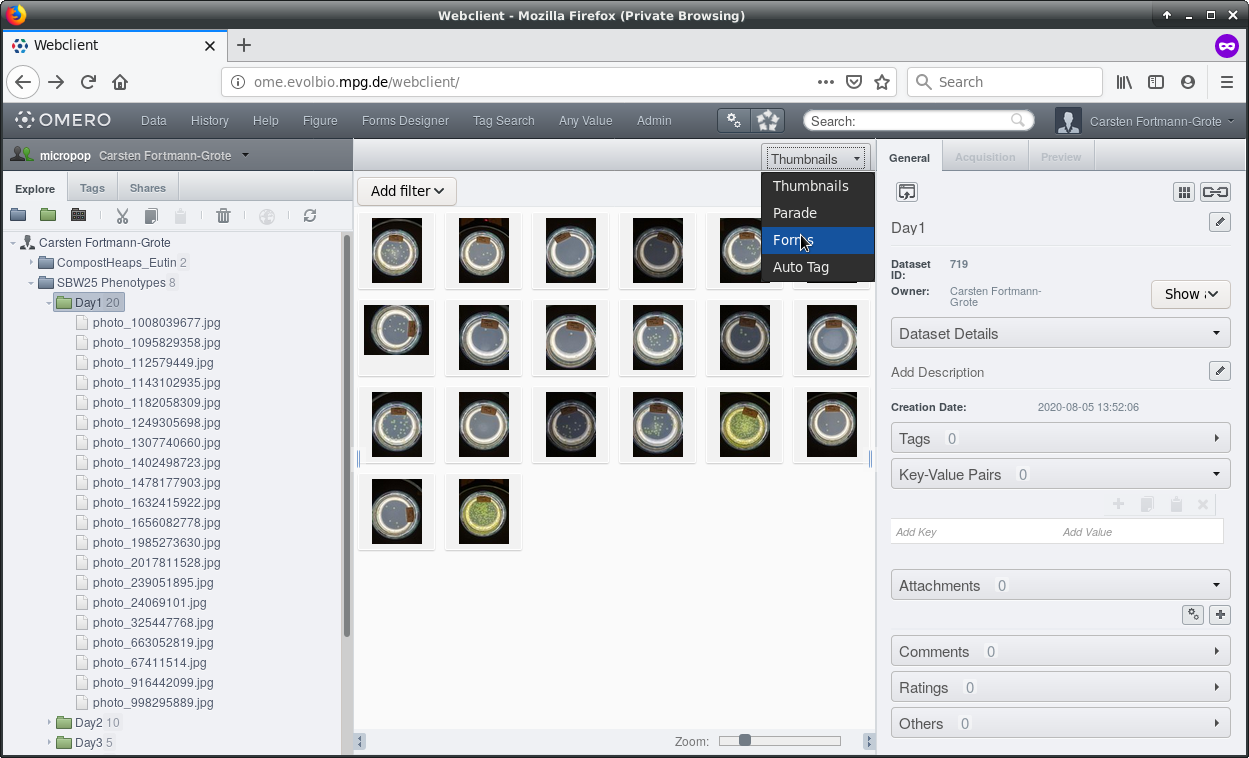
Omero container objects, i.e. projects, datasets, screens, and plates can be annotated through
Annotation Forms. After selecting the dataset, select  from the menu above the
central panel. If you cannot select the “Forms” entry, make sure you have not
selected multiple images or your account name in the left navigation panel.
from the menu above the
central panel. If you cannot select the “Forms” entry, make sure you have not
selected multiple images or your account name in the left navigation panel.
You can now select the appropriate form. There is one generic form for the Institute and several forms for individual departments and research groups. Specialized forms can be made available on request.
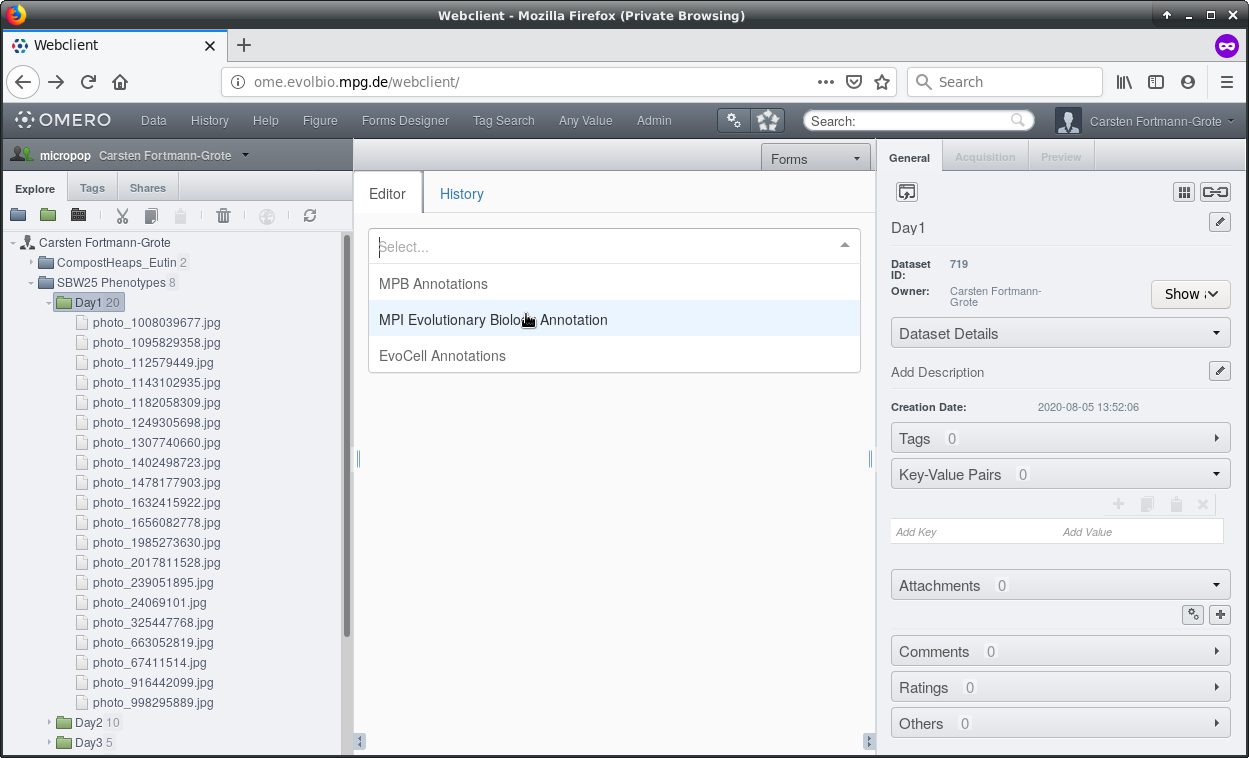
Here we choose the MPB form.
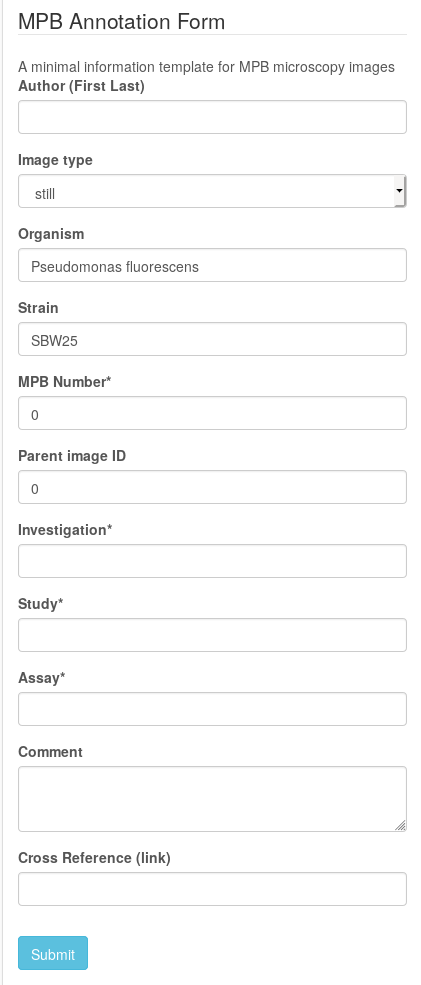
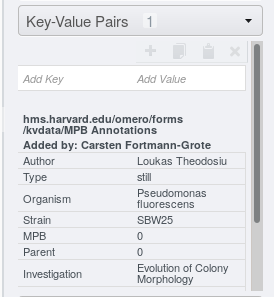
We fill out the fields (mandatory fields are marked*) and click on submit.
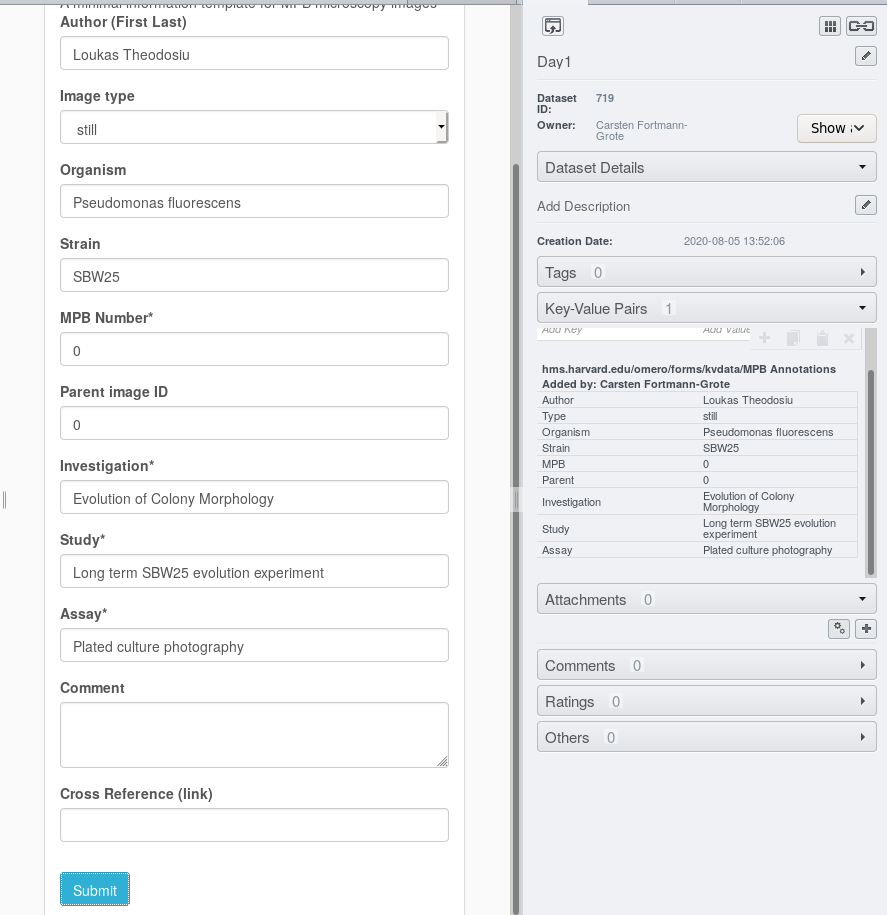
This will populate the Key-Value annotations in the right metadata panel with the form entries.
Using a spreadsheet to batch annotate images in a dataset
Above, we have used the Omero Annotation Forms to annotate a dataset. Omero annotation forms are meant to annotate container objects (Project, Dataset, Screen, or Plate). Annotating individual images through a form is not supported, as one would have to enter the same information (e.g. Author) into the form for each image over and over again. For typical datasets of several 100 images, this soon becomes unproductive. This is where batch annotation through spreadsheets comes in. The idea is that the author keeps track of image filenames and metadata information in a spreadsheet document (e.g. MS Excel (R)) either during the microcopy session or when importing the images into Omero. This spreadsheet can then be uploaded to Omero and attached to the container object hosting the referenced images.
For our example, such a spreadsheet could look as follows:
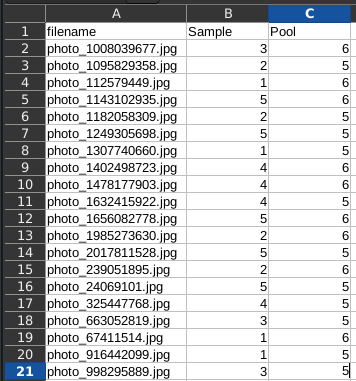
Here, we have entered the information from the petri dish tags into a table. The first column is the filename of the image.
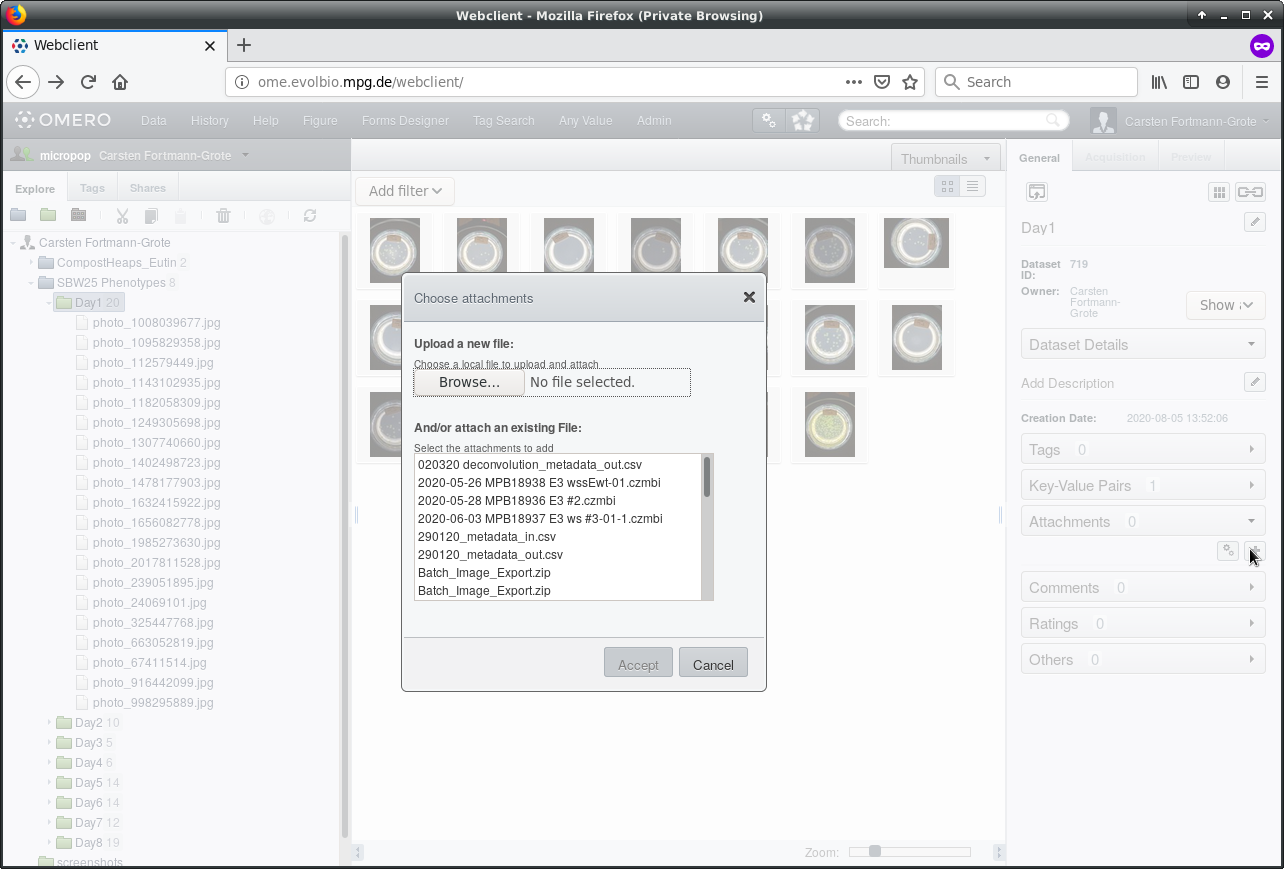
Let’s attach the spreadsheet to our dataset: In the left panel, select the
dataset that holds the images to annotate. Locate the Attachments menu
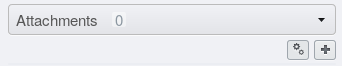
in the right metadata panel and click on the  button. This will open a file selection dialogue. Click “Browse” to select the spreadsheet from your file directory. Note: The spreadsheet must be in .csv format. If you use a spreadsheet program such as MS Excel (R) to edit the table, make sure to separate columns by comma (","), not semicolons (";") or tabs ("\t") when exporting to csv.
Click on  in the file selection
dialogue
in the file selection
dialogue
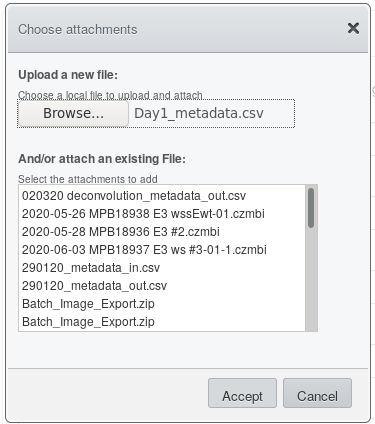 .
.
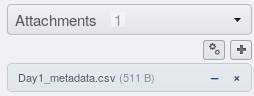
The spreadsheet document (csv) will then show up as an attachment of your dataset.
Extract metadata from csv and add to image annotation
The next step is to extract the attached csv file and attach the extracted information as key-value pairs to the images. The images are identified by the image name given in the first column of the spreadsheet. The remaining column names are used as keys and the cell values of each row are then entered as values in the new key-value pairs.
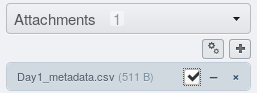
First, we select the csv file to extract the metadata from:
Click the  button in Attachment menu
shown above. Then, select (check the box) next to the csv file uploaded in the
previous step.
button in Attachment menu
shown above. Then, select (check the box) next to the csv file uploaded in the
previous step.
Next, we run a script from the Omero scripts collection:
Click on the button in the the menu bar on the top of the omero web client.
Select  and then
  .
.
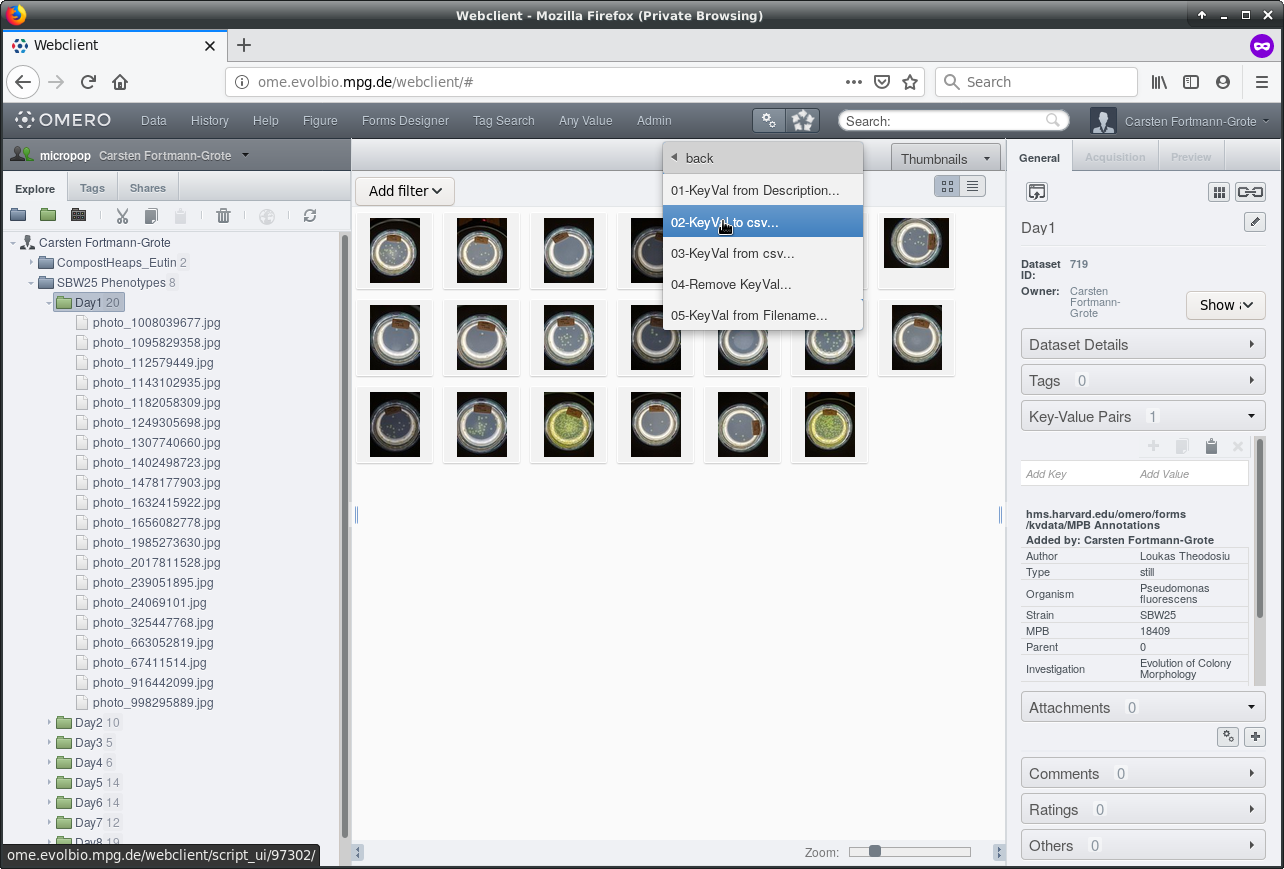
This will bring up the script configuration dialogue.
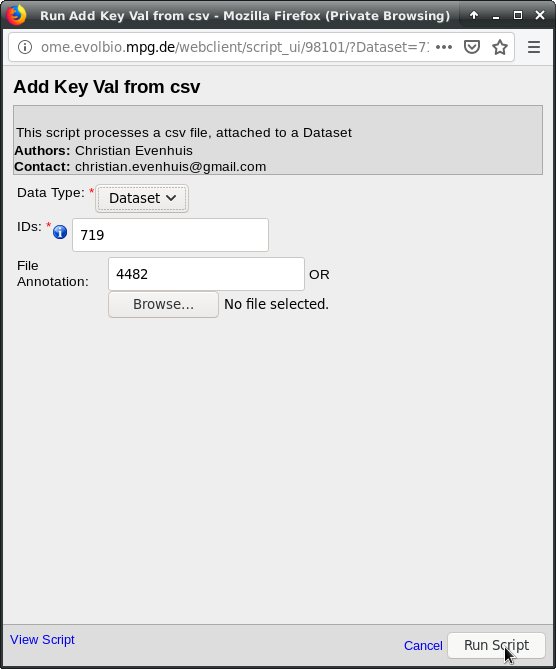
Check that the “IDs” field shows the ID of the dataset holding the images to
annotate: 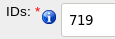 . The “File Annotation”
states the ID of the spreadsheet attachment. In case you did not select the
attachment in the previous step, you could enter the attachment ID here.
. The “File Annotation”
states the ID of the spreadsheet attachment. In case you did not select the
attachment in the previous step, you could enter the attachment ID here.
NOTE: The dialogue also offers to select an annotation file from a
file directory by clicking on the  button. However, this option is currently in a disfunctional state and cannot
be used for batch annotation.
button. However, this option is currently in a disfunctional state and cannot
be used for batch annotation.
Finally, click  . After a little
while, you should see a notification telling you about the success (or failure)
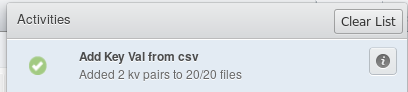
of the script. If all goes well, you’ll see something like this:
. After a little
while, you should see a notification telling you about the success (or failure)
of the script. If all goes well, you’ll see something like this:
In case something went wrong, make sure to check the following:
- The filenames in the uploaded csv file match the filenames of you images in the dataset
- The dataset ID matches the “IDs” field in the script configuration dialogue.
- The annotation file (attachment) ID matches the “File Annotation” field in the script configuration dialogue.
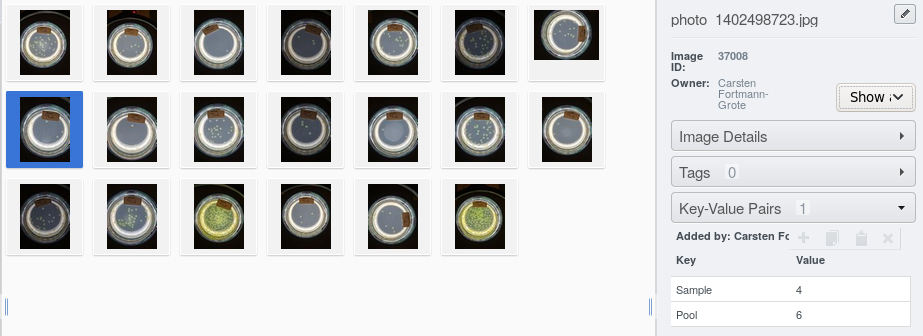
Confirm that each image is now annotated with the information given in the spreadsheet.
Combining Form annotation and spreadsheet batch annotation (spreadsheet templating)
We have seen how to annotate a container object using an Annotation Form and how to batch-annotate images within a container using a spreadsheet. What’s missing is a way to prefill the cells in an annotation spreadsheet that are constant for all or a subset of images. In other words, we generate a spreadsheet template from an annotation form and then use that template to batch-annotate individual images.
Example: Let’s assume, we would like to annotate each image with the ISA triplet, the Investigation, Study, and Assay. On the level of a dataset, this can be done through an Annotation Form. To copy the generic information into a spreadsheet, we do the following:
Copy dataset annotation to images
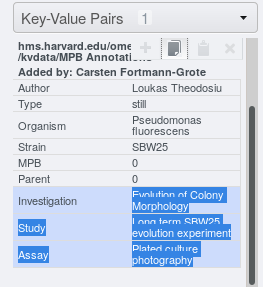
Key-value pairs can be copied and pasted onto other objects. From the dataset,
expand the Key-value list
 Select all key-value pairs to copy by clicking on the first row, then press and
hold down the [Shift] key on your keyboard and click on the last row to be
selected. Alternatively, select individual rows by clicking each row while
holding the [Ctrl] key pressed down.
Select all key-value pairs to copy by clicking on the first row, then press and
hold down the [Shift] key on your keyboard and click on the last row to be
selected. Alternatively, select individual rows by clicking each row while
holding the [Ctrl] key pressed down.
After selecting the key-value pairs to be copied, click the
 button on top of the Key-Value Pairs
list.
button on top of the Key-Value Pairs
list.
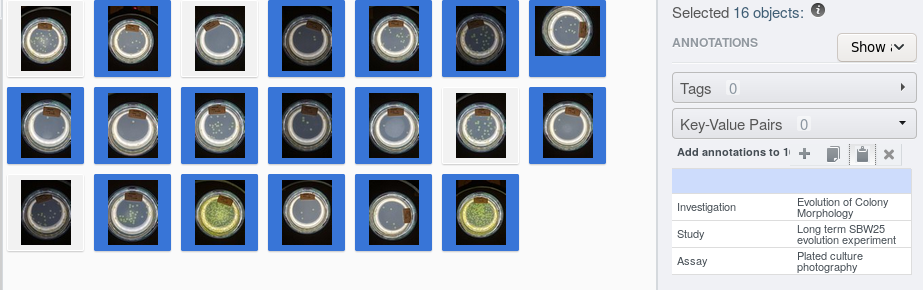
Next, we will paste the copied key-value pairs to the images that we want to annotate. In the navigation panel on the right, or in the thumbnails browser in the central panel, select the images to be annotated in the same way: Click on the first image, press and hold down the [Shift] key and click the last image. Or select individual images while holding down the [Ctrl] key. You can even “rectangle-select” images by holding down the left mouse button while moving your mouse across the central panel.
Click into the first empty row in the Key-Value Pairs list on the right and then
click on the  button to paste the
copied key-value pairs into the selected images.
button to paste the
copied key-value pairs into the selected images.
The selected images are now annotated with the ISA triplet.
Exporting annotations to a spreadsheet
Example: Let’s now assume, about 70% most of our images are taken from the same strain, the remaining 30% of images are taken from a different strain. Instead of going through all images and add the corresponding key-value pair, we can export our key-value annotations to a spreadsheet, modify the cells in question and the re-attach the corrected annotation spreadsheet to the dataset and extract the key-value pairs as explained above.
To export the dataset’s key-value pairs to a csv file, select the button in the top menu and click on , then on
 .
.
In the script dialogue, confirm that the dataset ID matches the dataset ID of
your selected dataset.
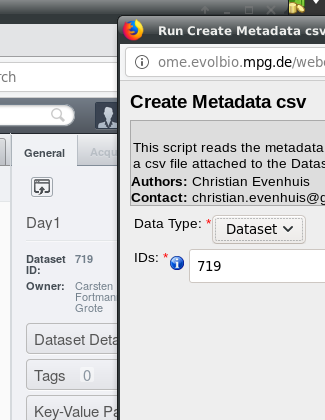
Then click on . The exported
annotation table will be attached to your dataset.
From here, you can download the spreadsheet, open it in your favourite spreadsheet program, re-upload the edited spreadsheet (in csv format) and extract the corrected annotations as demonstrated above.